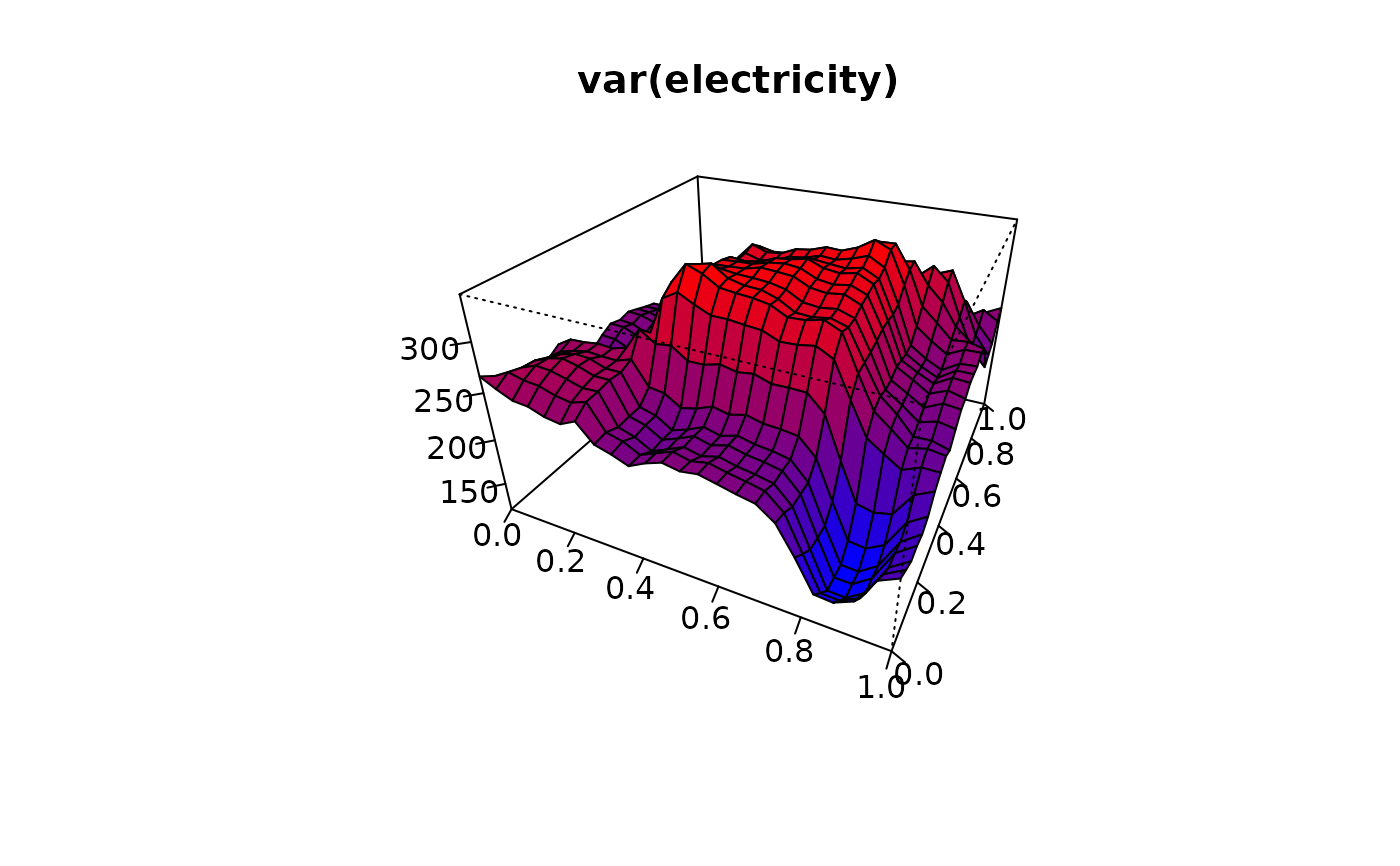
Plot dfts objects
plot.dfts.RdProvides various visualizations for functional data.
Usage
# S3 method for class 'dfts'
plot(
  x,
  changes = NULL,
  type = c("spaghetti", "fast", "rainbow", "banded", "acf", "pacf", "summary", "qq",
    "distribution", "change", "interval", "surface"),
  plot_title = x$name,
  val_axis_title = NULL,
  res_axis_title = NULL,
  FD_axis_title = NULL,
  eye = NULL,
  aspectratio = NULL,
  showticklabels = TRUE,
  lag.max = 20,
  d.max = 2,
  alpha = 0.05,
  TVE = 0.95,
  distribution = c("norm"),
  method = c("Welch", "MC", "Imhof"),
  legend = TRUE,
  highlight_changes = TRUE,
  intervals = confidence_interval(x, changes),
  int.gradual = TRUE,
  ...
)
Arguments
- x
A dfts object or data which can be automatically converted to that format. See
dfts().- changes
Vector of numeric change point locations. Can be NULL.
- type
Choice of plotting method. Options include: 'spaghetti', 'fast', 'rainbow','banded','acf', 'pacf', 'summary', 'qq', 'distribution', 'change', 'interval', and'surface'.
- plot_title
Title to include on the return plot.
- val_axis_title, res_axis_title, FD_axis_title
Title for the axis giving the values (val), the resolution of the fparam (res), and the functional observations (FD).
- eye, aspectratio
Angle (eye) and ratio (aspectratio) to view 3d plots.
- showticklabels
Boolean if the tick marks should be shown.
- lag.max
Max number of lags to consider for ACF/PACF and summary plots.
- d.max
Max number of dimensions for qq/distribution and summary plots.
- alpha
Significance level to be used in various plots. Value in [0,1].
- TVE
Total variance explained used in qq/distribution plots. Value in [0,1].
- distribution
String of the distribution to compare against in. distribution plot. The string can be anything such that there is a rdistribution and ddistribution function available. For example 'exp', 'gamma'. Additional parameters can be passed using ... .
- method
Method for computing ACF/PACF. Options include 'Welch', 'MC', and 'Imhof'.
- legend
Boolean if legend should be given in qq/distribution plots.
- highlight_changes
Boolean if changes should be highlighted in black.
- intervals
Information on confidence intervals of changes for change plot. See
confidence_interval().- int.gradual
Boolean if confidence interval be solid gray (FALSE) or gradual colors (TRUE) when
type='change'plot.- ...
Details for plotting in acf/pacf, summary, or distribution function.
